If any of the views described below is not visible, you can open it using the → menu.

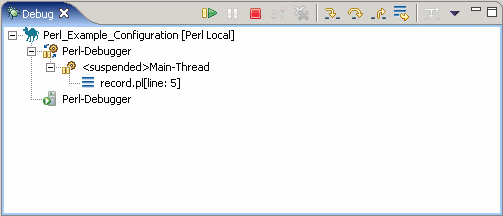
This view allows you to manage the debugging or running of programs in the workbench. It displays the stack frames for the suspended program you are debugging. It also displays the process for each target you are running.
If the program is suspended, its stack frames are shown as child elements. Clicking on a stack frame takes you to the corresponding line in the Perl editor and updates contents of the Variables view. If necessary, a new editor is opened automatically.
Note
EPIC does not currently include support for debugging multi-threaded programs.

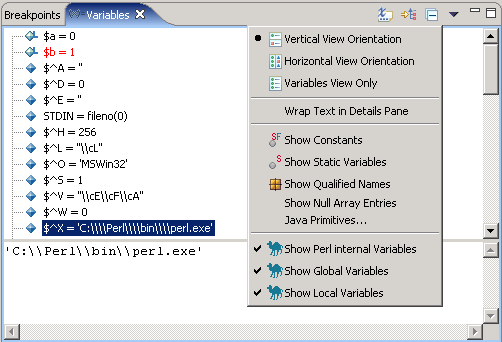
When a stack frame is selected, you can see the visible variables in that stack frame in the Variables view. The view shows the value of primitive (scalar) types. Variables which point to data structures such as hashes, lists or objects can be examined by expanding them to show their members. Variables that are references are dereferenced to show the final scalar value or data structure pointed to by the reference chain (or an indication of cyclic reference).
Global variables (including Perl internal variables) are marked with an
 icon,
local variables with an
  icon.
icon.
You can customize the presentation with the configuration menu:
Show Details Pane
To show the detail pane select Vertical View Orientation or Horizontal View Orientation. Select Variables View Only to disable it. The details pane shows the value of primitive variables (especially useful for string variables).
Highlight Updated Variables
If you enable this option, the variables whose values have changed during the last execution step (since the last suspend) and new variables will be highlighted. If a change has occurred inside of a complex variable, the variable will be highlighted and the path to the changed value will also be indicated using delta symbols:

This makes it possible to see these kinds of changes even if variables are collapsed.
Note
This feature requires EPIC to retrieve and remember the value of every variable on each suspend. It may be very slow for larger programs (e.g. it might take about 20 seconds for a program containing data structures with 5000+ values). For this reason, the option is disabled by default and should be used with care.
Select Variables to Display
The variables view allows to select the following types of variables for displaying by checking the corresponding menu entry:
-
Perl Internal Variables: these are variables provided by the Perl interpreter like
$_,@INCetc. -
Global Variables: variables visible from everywhere in your program. More precisely, these are the variables from the symbol table of the package in which the debugger is suspended or from the
mainpackage (in scripts). -
Local Variables: variables declared with the keyword
my, more correctly called "lexical" variables in Perl. To show lexical variables, you need to install the Perl PadWalker module. The PadWalker module has some problems which influence viewing of local variables.
Show Addresses of Variables
By default, EPIC shows the address to which a reference variable points, but it does not show the address of each non-reference variable. This additional information can be helpful when you wish to check which variable is pointed to by a reference. When enabled, the address of each variable (including scalar variables) will be displayed right before its value.

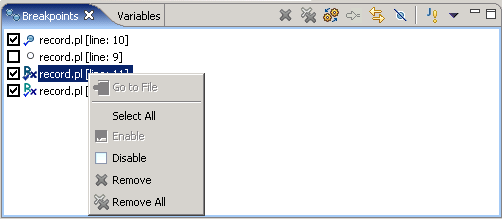
The Breakpoints view shows all breakpoints (see the section called “Breakpoints”), their state and location.
By selecting one or more breakpoints and invoking the context menu, you can enable, disable or remove these breakpoints.

